3 Overview of Project Procedures
Effective management of the software development process requires effective measurement of that process.
This guide presents an overview of the collection, analysis, and reporting of software metrics. Only the progress, effort and trouble report metrics are required for the project. However, the student should be familiar with all the metrics described below.
Software metrics are numerical data related to software development. Metrics strongly support software project management activities. They relate to the four functions of management as follows:
1. Planning - Metrics serve as a basis of cost estimating, training planning, resource planning, scheduling, and budgeting.
2. Organizing - Size and schedule metrics influence a project's organization.
3. Controlling - Metrics are used to status and track software development activities for compliance to plans.
4. Improving - Metrics are used as a tool for process improvement and to identify where improvement efforts should be concentrated and measure the effects of process improvement efforts.
A metric quantifies a characteristic of a process or product. Metrics can be directly observable quantities or can be derived from one or more directly observable quantities. Examples of raw metrics include the number of source lines of code, number of documentation pages, number of staff-hours, number of tests, number of requirements, etc. Examples of derived metrics include source lines of code per staff-hour, defects per thousand lines of code, or a cost performance index.
The term indicator is used to denote a representation of metric data that provides insight into an ongoing software development project or process improvement activity. Indicators are metrics in a form suitable for assessing project behavior or process improvement. For example, an indicator may be the behavior of a metric over time or the ratio of two metrics. Indicators may include the comparison of actual values versus the plan, project stability metrics, or quality metrics. Examples of indicators used on a project include actual versus planned task completions, actual versus planned staffing, number of trouble reports written and resolved over time, and number of requirements changes over time.
Indicators are used in conjunction with one another to provide a more complete picture of project or organization behavior. For example, a progress indicator is related to requirements and size indicators. All three indicators should be used and interpreted together.
The metrics to be collected provide indicators that track ongoing project progress, software products, and software development processes.
The defined indicators are consistent with the Software Engineering Institute's Capability Maturity Model (CMM). Table 1 shows the indicator categories, the management insight provided, and the specific indicators for recommended metrics. Depending upon the nature of the project, specific contractual requirements, or management preference, a project may choose to collect additional metrics or to tailor the recommended set.
Chart Construction Summary
Charts are prepared for the standard metrics. All charts require titles, legends, and labels for all axes. They should clearly and succinctly show the metrics of interest, with no excessive detail to detract the eye. Do not overuse different line types, patterns, or color, or added dimensionality unless used specifically to differentiate items. Overlayed data is preferable to multiple charts when the different data are related to each other and can be meaningfully depicted without obscuring other details.
The most common type of chart is the tracking chart. This chart is used extensively for the Progress indicator, and is used in similar forms for many of the other indicators. For task progress, it depicts the cumulative number of planned and actual task completions (or milestones) against time. For other indicators, it may show actual versus planned staffing profiles, actual versus planned software size, actual versus planned resource utilization or other measures compared over time.
There are many ways to modify the tracking chart. A horizontal planned line representing the cumulative goal can be drawn at the top, multiple types of tasks can be overlaid on a single tracking chart (such as design, code, and integration), or the chart can be overlaid with other types of data.
It is recommended that tracked quantities be shown as a line chart, and that replanned task progress be shown as a separate planning line. The original planned baseline is kept on the chart, as well as all replanning data if there is more than a single replan.
The following sections provide brief descriptions of the different metrics categories with samples of the required charts. Individual projects may enhance the charts for their situations or have additional charts for the categories. The sample charts are designed for overhead presentations and are available as templates from the professor.
Table 1 Recommended Metrics Set for a Project
|
Indicator Category |
Management Insight |
Indicators |
| Progress | Provides information on how well the project is performing with respect to its schedule. | Actual vs. planned task completions
Actual vs. planned durations |
| Effort | Provides visibility into the contributions of staffing on project costs, schedule adherence, and product quality. |
Actual vs. planned staffing profiles |
| Cost | Provides tracking of actual costs against estimated costs and predicts future costs. | Actual vs. planned costs
Cost and schedule variances |
| Review Results | Provides status of action items from life-cycle review. | Status of action items |
| Trouble Reports | Provides insight into product and process quality and the effectiveness of the testing. | Status of trouble reports
Number of trouble reports opened, closed, etc. during |
| Requirements Stability | Provides visibility into the magnitude and impact of requirements changes.
|
Number of requirements changes/clarifications
Distribution of requirements over releases |
| Size Stability | Provides insight into the completeness and stability of the requirements and into the ability of the staff to complete the project within the current budget and schedule. |
Size growth
Distribution of size over releases |
| Computer Resource Utilization | Provides information on how well the project is meeting its computer resource utilization goals/requirements. |
Actual vs. planned profiles of computer resource utilization |
| Training | Provides information on the training program and staff skills. |
Actual vs. planned number of personnel attending classes |
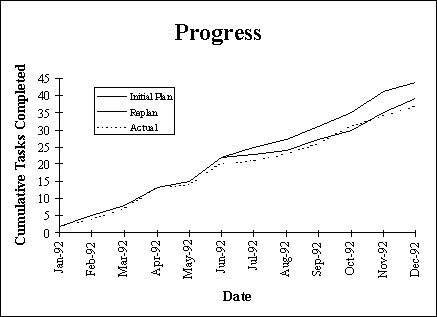
Progress indicators provide information on how well the project is performing with respect to planned task completions and keeping schedule commitments. Tasks are scheduled and then progress is tracked to the schedules. Metrics are collected for the activities and milestones identified in the project schedules. Metrics on actual completions are compared to those of planned completions to determine whether there are deviations to the plan. The difference between the actual and planned completions indicates the deviations from the plan.
Each project identifies tasks for which progress metrics will be collected.
The completion criteria for each task must be well defined and measurable. The project should establish range limits (thresholds) on the planned task progress for the project. The thresholds are used for management of software development risk.
Figure 1 depicts the cumulative number of planned and actual completions (or milestones) over time. Note that this chart is generic, and each project will substitute specific tasks (units, milestones, SLOCs, etc. ). Additionally, each project is expected to produce multiple progress charts for different types of tasks, different teams, etc.
Figure 1 Progress Indicator
Effort indicators allow the software manager to track personnel resources. They provide visibility into the contribution of staffing to project costs, schedule adherence, product quality and the amount of effort required for each activity. Effort indicators include trends in actual staffing levels, staffing profile by activity or labor category, or a profile of unplanned staff loses.
Effort indicators may be used by all levels of project software management to measure the actual profile against the plan. Each level of management forms a profile for its area of control and monitors the actual profile against the plan.
Determining the number of staff needed at any one time is an important function performed by software management. By summing the number of staff during each reporting period, the composite staffing profile for the project can be determined.
These indicators are applied during all life-cycles phases, from project inception to project end. Effort metrics are to be collected and reported at least on a monthly basis.
The effort and cost metrics are related. By convention, effort metrics are non-cumulative expenditures of human resources, and cost metrics are cumulative levels of effort as tracked by earned value. Thus, cost metrics are a cumulative depiction of effort.
Figure 2 shows a sample plot of monthly actual versus planned effort
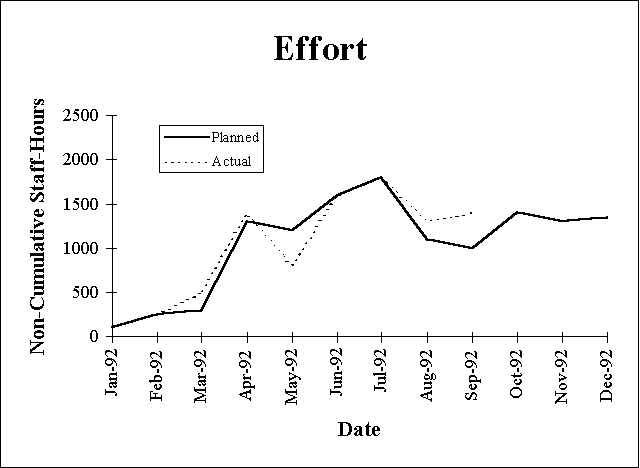
Figure 2 Effort Indicator
Cost management is an important activity for the success of a project, and labor is the primary component of software development cost. Managers must define the work in their area, determine the skill level required to perform the work, and use productivity estimates and schedule constraints to determine budgeted costs over time.
Use staff-hours to measure cost, rather than dollars. The dollars per staff-hour varies over time and by labor category, and the conversion is made only by Finance. Cost is related to the effort indicator, with cost defined as an accumulation of effort expenditures. (The total project cost also includes non-labor costs, but they are not tracked here.) Only those projects using earned value can report the earned value quantities.
A Work Breakdown Structure (WBS) is established to define the structures that will be used to collect the costs. The WBS identifies separate elements for requirements, design, documentation, code and unit test, integration, verification, and system testing. Costs can also be segregated by component, function, or configuration item. Work packages are derived from the WBS. Costs are allocated to work packages using an earned value method. This system allows managers to track the actual costs and measure them against the budget for their respective areas of responsibility.
Figure 3 is a sample Cost Indicator Chart. The actual and budgeted quantities are derived from an earned value system, and are shown in terms of staff-hours.
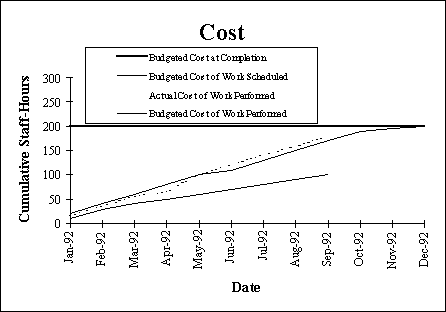
Figure 3 Cost Indicator
Review Results indicators provide insight into the status of action items from life-cycle reviews. The term Action Item (AI) refers to inspection defects and customer comments. Reviews include the following:
There are standards for some reviews, as well as procedures for conducting them. For example, formal inspections result in assertion logs that document the minor and major defects uncovered by the inspection process. Therefore, standard review result indicators for formal inspections are:
1. Counts of minor/major defects
2. Rates of defect detection (e.g., assertions per inspection meeting minute, defects per inspected document page, or defects per KSLOC of code inspected)
3. Defect status (e.g., age of open defects, number of open/closed defects, and breakdown by defect categories).
A customer-conducted review such as a Preliminary Design Review (PDR) generates AIs that must be closed before approval of the Software Design Document. Therefore, standard review result indicators for a PDR are the number of comments written and their status (open, closed, and age).
Review metrics record the AIs identified in the review findings and track them until they are resolved. These metrics provide status on both products and processes. Review results are not to be used to evaluate the performance of individuals.
Review Results are collected and reported at least monthly at every stage of the software life cycle, but preferably weekly for key AIs.
Figure 4 depicts the cumulative counts of AIs written and closed by reporting period.
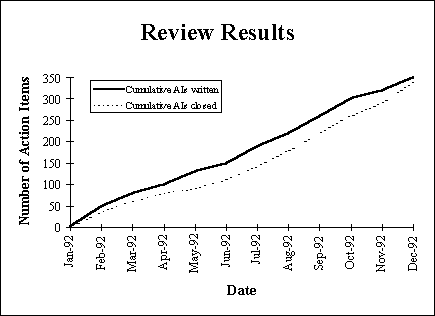
Figure 4 Review Results Indicator
TR indicators provide managers with insight into the quality of the product, software reliability, and the effectiveness of testing. They also provide information on the software development process. The terms defect and problem will be used interchangeably herein. Monthly tracking of TR indicators shows the project's trends in the following areas:
1. The rate at which TRs are being written and resolved.
2. The type and severity of the TRs.
3. Relationship between the number of TRs and the number of test cases passed or the number of test steps passed.
4. The TR density (the number of TRs per unit size).
5. The number of defects in each software application/unit.
TR indicators are applicable only in the following life cycle stages (and each release of the software within these stages, and during the informal and formal test segments of these stages) (1) application test and integration, (2) system test, (3) acceptance test. Thus the TR indicators are applicable only to defects during the operation or execution of a computer program. Due to the shortness of testing periods, and the dynamics involved between the test team and the implementation team that analyzes the TRs and fixes the defects, the TR indicators are generally evaluated on a weekly basis.
The terms open and closed are defined as follows:
Open The problem has been reported.
Closed The investigation is complete and the action required to resolve the problem has been proposed, implemented, and verified to the satisfaction of all concerned. In some cases, a TR will be found to be invalid as part of the investigative process and closed immediately.
Figure 5 shows the cumulative count of total, open, and closed TRs over time (weekly periods).
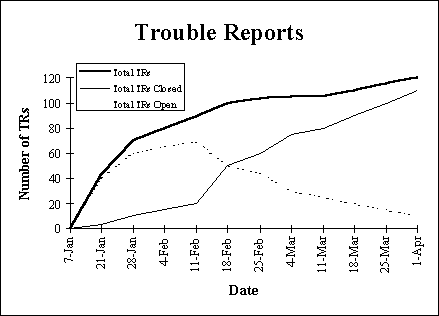
Figure 5 TR Indicator
Requirements Stability provides an indication of the completeness, stability, and understanding of the requirements. It indicates the number of changes to the requirements and the amount of information needed to complete the requirements definition. A lack of requirements stability can lead to poor product quality, increased cost, and schedule slippage.
Requirements stability indicators are in the form of trend charts that show the total number of requirements, cumulative changes to the requirements, and the number of TBDs over time. A TBD refers to an undefined requirement. Based on requirements stability trends, corrective action may be necessary.
Requirements stability is applicable during all life-cycles phases, from project inception to the end. The requirements stability indicators are most important during requirements and design phases. Requirements stability metrics are collected and reported on a monthly basis.
Figure 6 shows an example of the total number of requirements, the cumulative number of requirements changes, and the number of remaining TBDs over time. It may be desirable to also show the number of added, modified and deleted requirements over time.
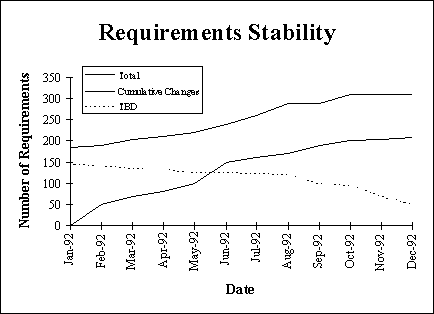
Figure 6 Requirements Stability Indicator
Software size is a critical input to project planning. The size estimate and other factors are used to derive effort and schedule before and during a project.
The software manager tracks the actual versus planned software product size. Various indicators show trends in the estimated code size, trends by code type, the variation of actual software size from estimates or the size variation by release.
Size stability is derived from changes in the size estimate as time goes on. It provides an indication of the completeness and stability of the requirements, the understanding of the requirements, design thoroughness and stability, and the capability of the software development staff to meet the current budget and schedule. Size instability may indicate the need for corrective action.
Size metrics are applicable during all life-cycle phases. Size metrics are collected and reported on a monthly basis, or more often as necessary.
Figure 7 shows an example of planned and currently estimated software size per release over time. Besides showing re-allocation of software content between releases, this also shows the growth in the total estimated size.
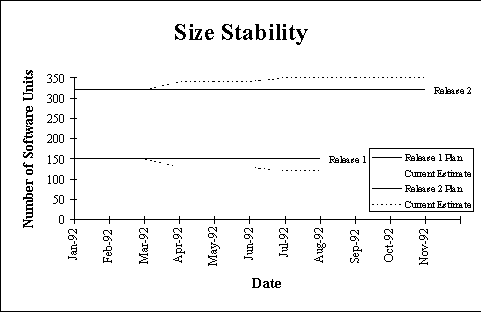
Figure 7 Size Indicator
Computer Resource Utilization indicators show whether the software is using the planned amount of system resources. The computer resources are normally CPU time, I/O, and memory. For some software, the constraints of computer resources significantly affect the design, implementation, and testing of the product. They can also be used to replan, re-estimate, and guide resource acquisition.
Computer resource utilization is planned during the requirements activity and reviewed during the design activity. Resources are monitored from the start of implementation activity to the end of the life cycle.
For memory utilization, the unit of data is the byte, word, or half-word. For CPU time, the unit of data is either MIPS (millions of instructions per second), or the percentage of CPU time used during a peak period. For I/O time, the unit of data is the percentage of I/O time used during a peak period.
Resource Utilization data is collected and reported at least monthly, with the period between collection and reporting becoming shorter as the software system nears completion and a better picture of software performance can be seen. Note that the resource utilization is normally an estimate until integration occurs, at which time the actual data is available.
Figure 8 shows an example of CPU and memory use as a percent of available and the maximum allowed.
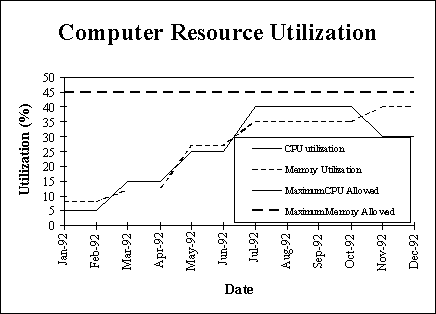
Figure 8 Computer Resources Indicator
Training indicators provide managers with information on the training program and whether the staff has necessary skills. A trained staff is a commitment. The manager must ensure that the staff has the skills needed to perform their assigned tasks. The objective of the training indicator is to provide visibility into the training process, to ensure effective utilization of training, and to provide project software managers with an indication of their staff's skill mixture.
The manager should investigate the deviations in the number of classes taught from the number of classes planned, and the deviation of the number of staff taught to the planned number. The quality of the training program should also be determined from completed course evaluation sheets. The number of waivers requested and approved for training should also be tracked.
Figure 9 shows a sample graph of the total monthly attendance of personnel attending training classes. It represents the sum of the number of personnel attending all classes.
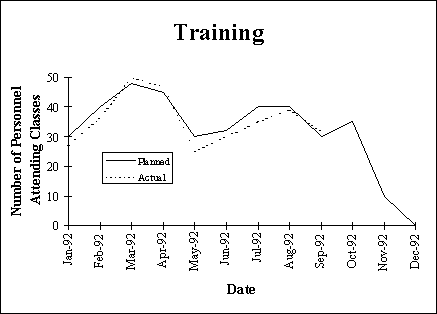
Figure 9 Training Indicator
Metrics are planned at project conception, used to track project status and recorded at the end of the project.
When starting a software development project, determine the list of software metrics. Use the goal-question-measure paradigm to select appropriate measurements for the project. To do this, first establish goals for the project, develop questions to be answered by measurement, and then collect the data needed. Document the software metrics to be collected for the project in the project plan.
During a project, collect and report the metrics. Use the collected metrics data to track project status.
At the end of a project, utilize the data for postmortem reporting.
Use automated data collection and analysis tools whenever possible to collect the metrics data for your project. Some tools that can aid in this process include Amadeus for code measurement, TR statusing tools, requirements management tools, etc. Excel spreadsheets are useful for generating metrics reports. Contact the professor for spreadsheet templates of the charts shown in this guide.