CS Senior Design Team
7 students
2020
-2021
- Contributions:
- Collect 2 years wildfire data
- Prediction based on state and county
- Data visualization
Predict the wildfire risk based on remote sensing data and geospatial data, and visualize processed data for researchers
Four remote sensing datasets were collected from the LPDAAC website using the data extract tool AppEEAR. California fire incident records for 2013 to 2023 were collected from the California Department of Forestry and Fire Protection (Cal Fire). A shape file of California was used to extract the exact regions of the state.
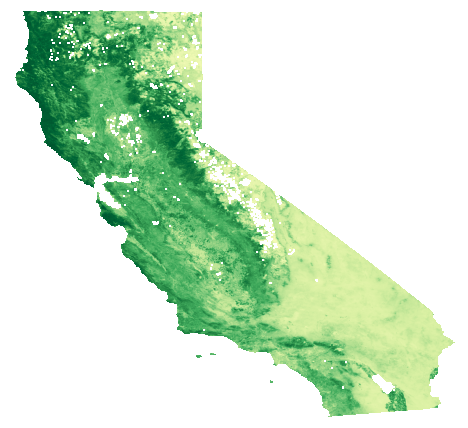
Enhanced Vegetation Index (EVI)
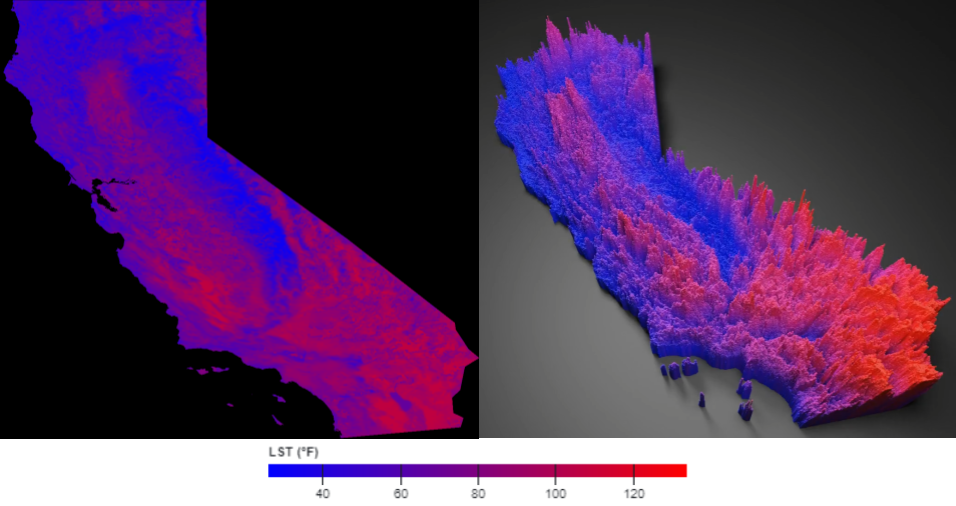
Land Surface Temperature (LST)
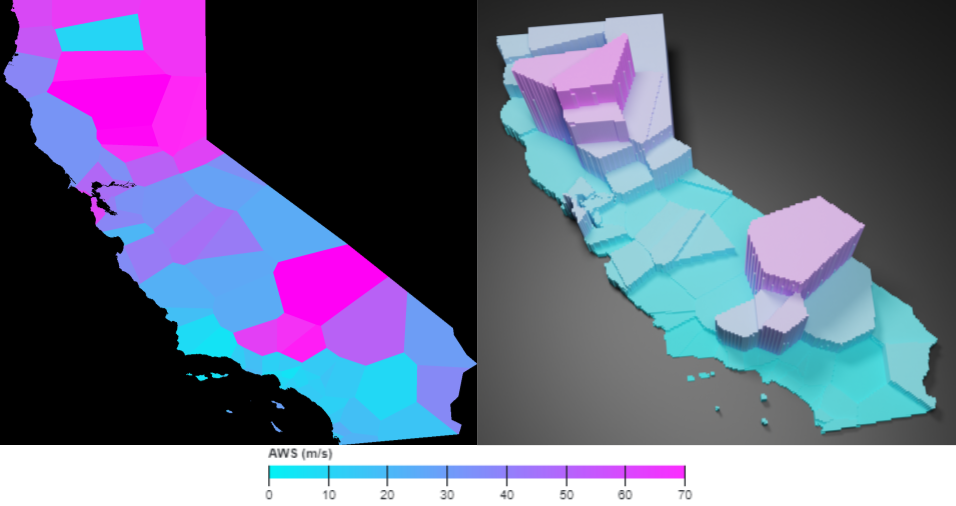
Wind Speed Data from Global Historical Climatology Network Daily database (GHCNd)
Data cleaning was performed on all of the remote sensing data to remove low-quality data or data with meteorological interference via masking. Each of the remote sensing data’s GeoTIFF files comes with a corresponding QA file that states the quality of the pixels in an image.
All remote sensing data was masked by their corresponding QA images in conjunction with the corresponding quality lookup table, which generated an array of good quality pixel values for feature extraction.
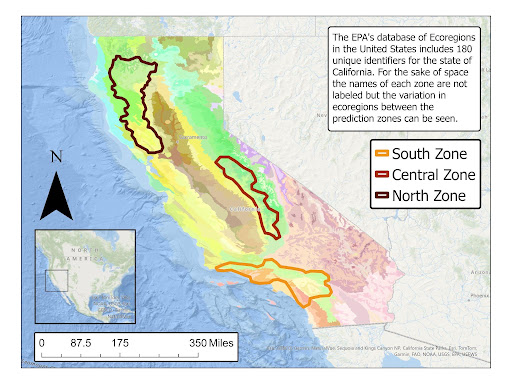
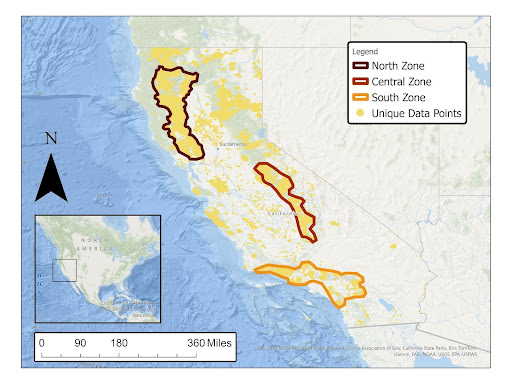
For the state level dataset, data clipping isolates data from recently burned regions to ignore data from regions that never caught fire in the given month of the daily time frame. The ignored data isn’t relevant for the models in identifying Fire/No fire from a region’s conditions. Data clipping was applied to the feature datasets using BA dataset’s images. When masking the LST and TA datasets, we resampled the BA images because of the resolution difference. For the county level dataset, data clipping was only used to subset GeoTiff images of CA into county images using county boundaries in the form of GeoJSON geometries. To increase the specificity of data to California's ecological regions and simplification of processing, the dataset was reduced to 3 prediction zones, North, Central, and South.
This step is only necessary for the NDVI dataset because it is in a 16 day temporality and the other two datasets (LST and TA) are daily. Linear interpolation from the Pandas library was applied to both the state and the county level datasets.
Feature extraction was applied to the NDVI, LST, and TA remote sensing data as well as the Cal Fire incident record. For the state level dataset, the clipping by BA step extracts regions from the feature dataset’s GeoTIFF images, resulting in a new raster GeoTIFF image. Each pixel of the new image contains a value for an area, and it is tied to a specific date. The values of all the pixels are averaged and stored as a CSV file with their corresponding dates, which are later abstracted out when all feature datasets and target class datasets are aligned. The columns in the fire record were reduced to include only start date, end date, and incident type
The nature of the data is such that there is a large disproportion between the number of regions labeled fire- prone vs. non-fire-prone. The ratio ranged from between 1:1200 to 1:32000 fire-prone to non-fire-prone data points from year to year. This issue was later connected to low model performance. To overcome this, oversampling of fire- prone data points and random undersampling of non-fire-prone data points using different algorithms and ratios was applied. Several oversampling algorithms were tried, including the Synthetic Minority Oversampling Technique (SMOTE), Adaptive Synthetic Algorithm (ADASYN), SMOTE with Tomek Links (SMOTE + TOMEK), and SMOTE with Edited Nearest Neighbors (SMOTE + ENN).
Because of the vast amounts of irrelevant data generated with respect to wildfire prediction, filtering was applied with a burned area mask to remove any data that has not been burned within the past 10 years. The filtered data was fed to the machine learning models with the data being split with 60% used for training, 20% for testing, and 20% for validation. A binary classification model was selected, as the target dataset only has two possible values (Fire-Prone and Not-Fire-Prone). Machine-learning models were selected and trained to find the best performance model.
We explored the usage of: dataset minibatching, dataset multiprocessing, and ensemble 3 machine learning models: SVM, GNB, and KNN. We accelerated our training and testing using GPUs. Overall experimental results showed up to a 4% improvement in accuracy and up to 50% reduction in training and testing time when the 3 models ensemble was compared to models running independently and directly on the CPU.
Approach Overview:
1) Each model receives the same of batched and processed data.
2) Each model will be individually trained.
3) Each trained model will be part of the ensemble that occurs during the testing/validation portion.
4) Each result derived comes from the ensemble mode.
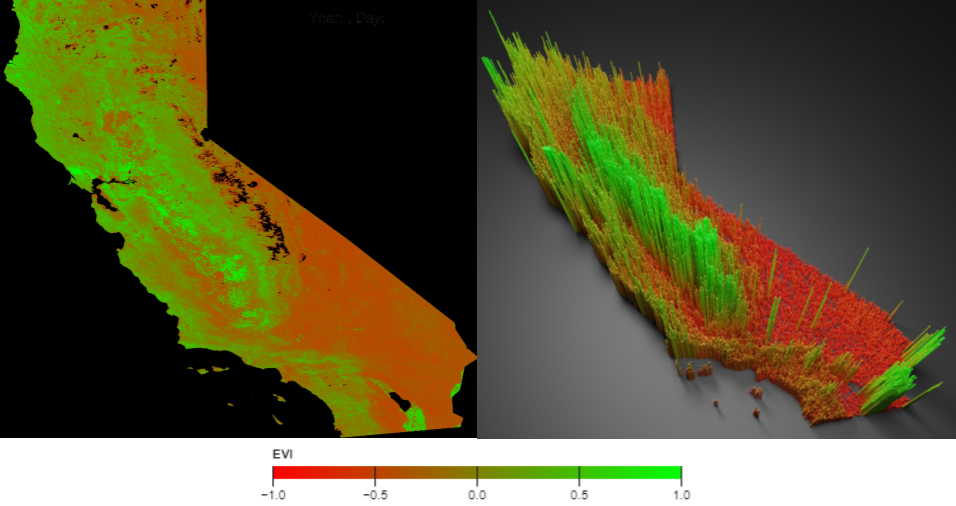
For each dataset, an image was generated for each day over the analyzed decade. Each pixel in the image represents a 500 m2 area, and the color of the pixel denotes the value of the index at that area.
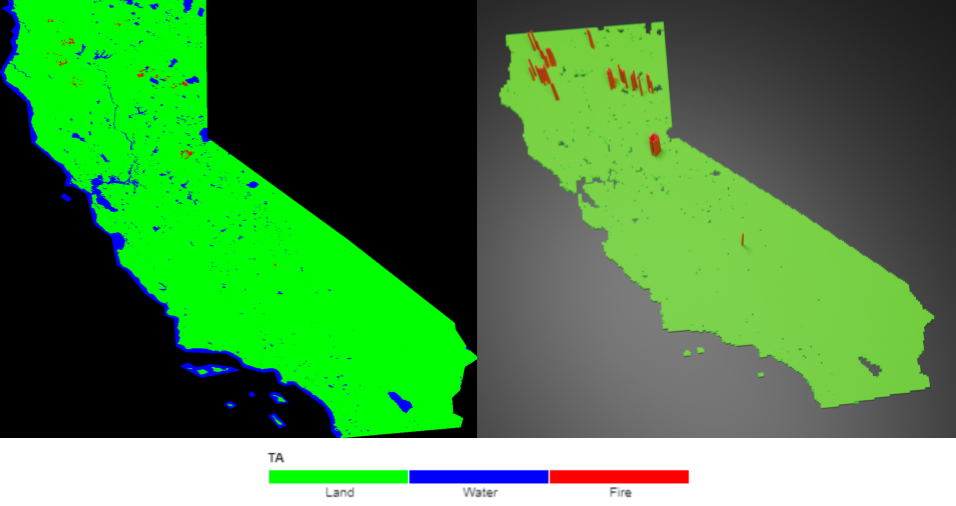
3D visualizations were generated using the Blender software. In addition to each region being assigned a certain color relating to the index value at that location, each region is also elevated upwards in the Z direction based on the value of the index for emphasis.
2D and 3D animations were generated for all five datasets by editing the images into a video in order to visualize the change in the indices over time.
A interactive single map with layers for each feature will be built, with window on the side shows detailed information based on users’ interactions. The features are elevation, land surface temperature, wind, vegetation, thermal anomalies, fire, and fire prediction. Each feature will be presented in a unique way tailored to the type of data, scale, and interactions with other features. When scrolling over or clicking on a point, the window will display all of the active layer information.
The elevation layer will be a 3-dimensional layer that all other layers are placed on top of.
The land surface temperature layer will be a 2-dimensional layer that is color-coded based on the temperature.
The wind layer will be a 2-dimensional layer that shows wind using symbols.
The vegetation layer will be a 3-dimensional layer that shows the vegetation index of an area.
Thermal anomalies are mostly consistent across the data so it will use a simple 2-dimensional visualization such as a contour layer or a custom layer built on a polygon layer.
Fire incidents and predictions will be represented with scatterplots.
Student teams participated in this project


This project is supported by the National Science Foundation Grant CNS-2244391.