Introduction
Significant energy wastage and increased CO2 emissions from automobile air conditioning systems highlight the critical need for enhanced energy prediction and management. This study investigates the potential of machine learning algorithms for energy prediction in A/C systems. By integrating vehicle data with external weather information, we developed a predictive model that accurately forecasts energy usage and identifies key factors influencing efficiency. These findings could facilitate the creation of intelligent control systems for automotive air conditioning, leading to enhanced energy savings and reduced emissions.
Data Collection, External Data Integration, Data Preprocessing
Data Collection
73 critical parameters were selected via the OBDLink application to monitor and record real-time data. These parameters were comprehensively chosen to cover a wide range of vehicle performance metrics, including but not limited to vehicle speed, engine revolutions per minute (RPM), ambient air temperature, mass air flow rate, instantaneous fuel consumption, and air conditioning power consumption. The OBDLink MX+ device was configured to capture the instantaneous values of these parameters at one-second intervals, subsequently storing this data in a comma separated values (CSV) file for detailed analysis. The data collection spanned approximately 700 miles across various terrains, times of day, weather, and traffic conditions in summertime Southern California, providing a robust dataset for evaluating the vehicle’s performance under diverse driving scenarios. By considering this broad range of weather conditions, times of day, and traffic scenarios, our data collection process enhances our later model’s ability to make accurate and reliable predictions in real-world environments. As the dataset reflects the complexities encountered in everyday vehicle operations, we can guarantee that the model’s results will produce real-life implications. During data collection, special attention was given to the vehicle’s A/C usage. The study periods were distinctly marked by intervals where the A/C system was either activated or deactivated. This approach allowed for an in-depth analysis of the A/C system’s impact on fuel efficiency and overall vehicle performance under varying environmental conditions.
External Data Integration
Recognizing the limitation of our dataset, which solely comprised vehicular data, we identified the necessity of incorporating ambient weather conditions to comprehensively evaluate the air conditioning system’s performance in vehicles. To address this gap, we integrated weather data using the OpenWeatherMap One Call API 3.0. This step involved appending a timestamp to our existing dataset and executing periodic requests to the API, thereby retrieving minute-by-minute weather metrics. To ensure continuity and accuracy within our dataset, we employed statistical methods, including linear and nearest neighbor interpolation, to interpolate missing data points between successive API calls. This enriched dataset included critical environmental parameters like temperature, humidity, wind speed, atmospheric pressure, and cloud coverage. Furthermore, to validate the integration of weather data from OpenWeatherMap, we conducted a comparative analysis between the external temperature readings obtained from the OBD-II logger and the one from API.
Data Preprocessing
the raw dataset obtained via the OBD-II presented several issues, including missing values, duplicate entries, and inconsistencies across various parameters. Employing Python within the Jupyter Labs environment, we embarked on a comprehensive data preprocessing phase. This phase involved consolidating individual trip datasets into a singular CSV file for subsequent cleansing operations. A crucial step in our preprocessing was eliminating redundant features, a task underscored by the frequent occurrence of near-identical OBD-II parameters.
Data Analysis
Feature Analysis
Understanding the influence of weather on vehicle A/C energy consumption is essential for improving automotive energy efficiency. We created line and scatter plots to analyze weather patterns and their effects on A/C performance. These visualizations helped us observe changes in weather attributes over time. Additionally, we compiled essential summary statistics of the weather attributes of the data. During data collection, we ensured that the majority of A/C settings were static to prevent confounding effects.
Correlations Analysis
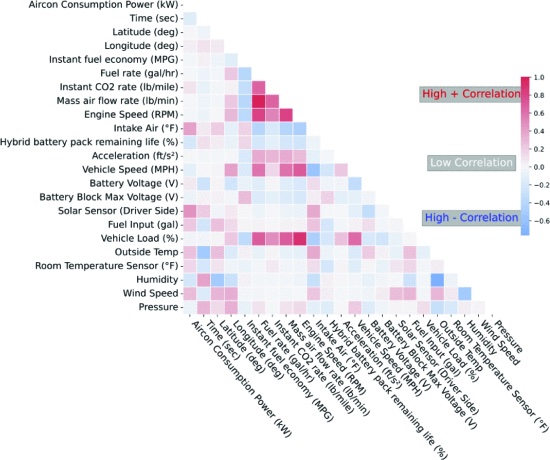
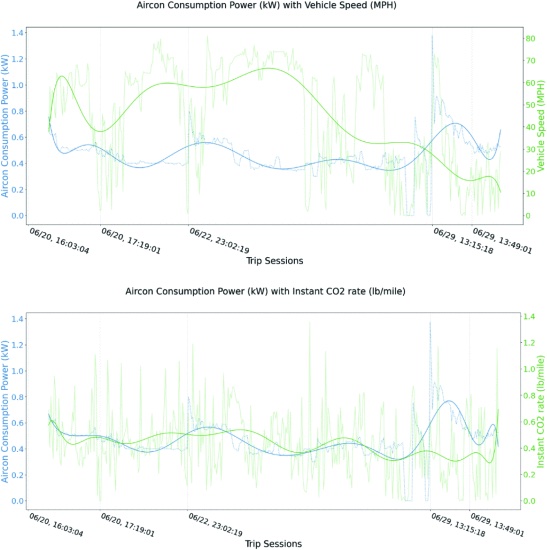
A correlation heatmap that spanned the relevant variables was used to visualize the features in our dataset. A/C energy consumption and solar sensor readings were highly correlated — the more direct sunlight hits the vehicle, the more the A/C is required to maintain comfortable temperature. A/C energy consumption and time passed are negatively correlated — as ambient temperature decreases in the cabin over time, the demand for air conditioning diminishes. We continued this analysis by examining correlated features in an isolated manner. Dual-axis charts paired with trendlines allowed for close of correlations between two features.
Heatmap of selected features
A/C Consumption Power vs MPH and CO2 Rate Trendline Graph
Data Normalization and Feature Selection
Normalization
There were two main normalization techniques that we tested, Z-score normalization and Min-Max normalization. Z-score handles outliers well, but does not produce normalized data with the exact same scale across all features. We decided to use the Min-Max scaler since it transforms features to a given range of -1 to 1, while maintaining the relationship among data points as it linearly scales the data. However, this comes at the cost of poorly handling outliers. Since we used several gradient descent algorithms like linear regression and neural networks, the Min-Max scalar was the better option.
Feature Selection
A variety of methods (Mutual Information, Feature Variance, and Recursive Feature Elimination (RFE)) were used to better inform the feature selection process. Mutual Information is a measure of mutual dependence between two variables; it shows how much information can be obtained from a random variable by observing another random variable. Feature Variance identifies the variance or spread of a certain feature. Recursive Feature Elimination (RFE) from SKLearn is a feature ranking system. An external estimator is trained on the initial set of features, assigning them an importance value.
Modeling, Tuning, and Results
Data Splitting
To ensure the reliability of our predictive models, we adopted an 80/20 train-test split, dedicating 80% of the dataset for training the models and the remaining 20% for testing and validation.
Linear and SGD Regressors
We initially started training regressor models that would predict A/C Consumption using variables selected by RFE. The Linear and SGD Regressor models that we trained were considered our base models so we have something to compare our future regressor models to. These models did not perform very well so we looked into other options.
Random Forest Regressor and XGBoost
To predict air conditioning (A/C) consumption in vehicles, we employed both Random Forest Regressor (RFR) and XGBoost models, leveraging features identified through Recursive Feature Elimination (RFE). Given the sequential nature of time-series data, which is crucial for understanding and forecasting future values, our initial approach refrained from shuffling the data points. This decision was based on the premise that the chronological order of observations plays a vital role in the accuracy of forecasting models.
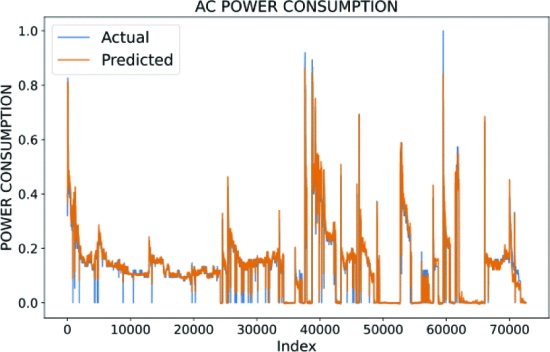
LSTM Neural Network
The model consists of multiple LSTM layers with increasing units, allowing the network to capture temporal patterns in the input data effectively. Batch Normalization layers are used to improve training stability. Dropout is added to mitigate over-fitting. The model ends with two dense layers for prediction, with the final layer having a linear activation function for regression tasks. The model is compiled with Mean Squared Error loss and Adam optimizer with a low learning rate for training. Root Mean Squared Error is used as a metric to monitor model performance during training.
LSTM Performance